Flat land, a good node, and the PPA price that makes it work.
Barrio Grid shows what solar actually gets paid at every ERCOT node, finds contiguous flat tracts near transmission, lays out trackers on one-meter lidar, and tells you whether the site pencils merchant or what PPA it needs.
Best-paid solar nodes in ERCOT this week
Average day-ahead price during solar hours by node, Nov 2, 2026 to Nov 9, 2026. Over the last 30 days ERCOT curtailed about 6.0% of the midday solar that was available, roughly 316 GWh. Refreshed every morning.
| Node | Solar-hour price | Capture ratio | Neg. solar hours | All-hours avg | |
|---|---|---|---|---|---|
| 1 | OLMITO_RN Cameron County | $150 | 1.41 | 0 | $107 |
| 2 | SILASRAY_CC1 zone | $150 | 1.41 | 0 | $107 |
| 3 | SIL_SILAS_6 Cameron County | $150 | 1.41 | 0 | $107 |
| 4 | KNAPP_RN Uvalde County | $95 | 0.71 | 0 | $134 |
| 5 | BAC_RN_ALL Houston zone | $70 | 1.19 | 0 | $58 |
| 6 | UCC_COG_PUN2 Galveston County | $70 | 1.19 | 0 | $58 |
| 7 | UCC_UCC_C_2 Houston zone | $70 | 1.19 | 0 | $58 |
| 8 | AMOCO_PUN2 Houston zone | $70 | 1.19 | 0 | $58 |
Solar-hour price is the node's average day-ahead price over hours ending 9 to 18 ($/MWh). Capture ratio is that price divided by the node's all-hours average: below 1 means midday power is worth less than the day as a whole, which is where most West Texas solar sits. Negative solar hours count midday hours priced below zero. Curtailment is ERCOT's available solar minus actual output over midday hours, an upper bound. Free accounts see 7 days; Pro adds monthly history back to 2024, the hourly midday shape and the worst curtailment days. Click a node to open it on the map.
How a solar screen runs on Barrio Grid
Each step is a tool your AI assistant can call through the connector, or a panel on the map.
- Free
Ask Dub in plain English
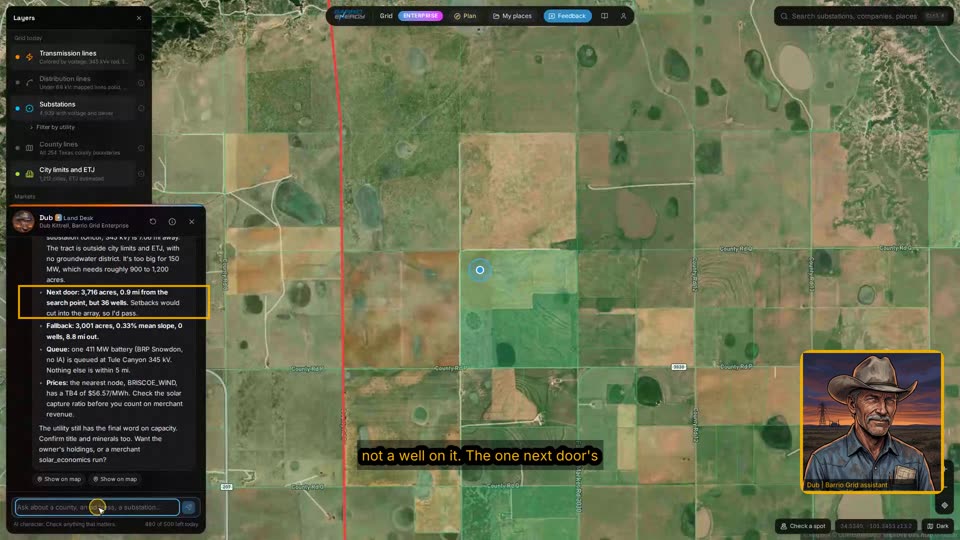
Describe the project and the area. Dub, the map's chat landman, pulls the nearest transmission and substation, what solar is paid at the closest node and what is already in the queue nearby.
- Free / Pro
Read the price where you would sell
Solar-hour price, capture ratio, negative hours and basis to the load zone at any node, plus ERCOT-wide curtailment. Pro adds monthly history back to 2024, real-time prices and the midday shape by region.
- Free / Pro
Estimate energy and revenue at a point
Expected MWh per MW from NASA irradiance for fixed tilt or trackers, times the capture price at the nearest node, less a curtailment haircut. A quick yes or no before anyone drives out.
- Enterprise
Find flat land near transmission
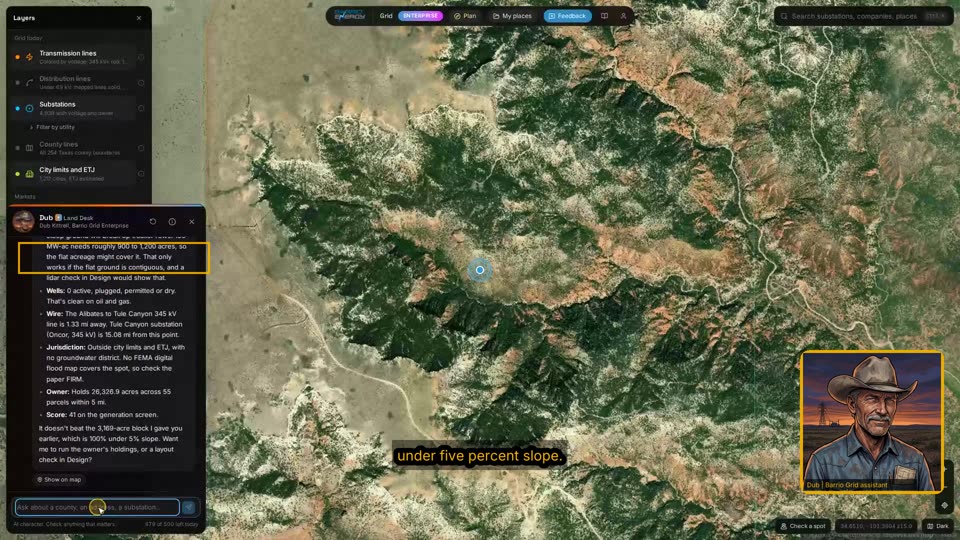
Contiguous same-owner tracts above an acreage, mostly under 5 percent slope from USGS elevation, within a distance of a 138 kV or larger line, with oil and gas wells on the land counted from Railroad Commission records.
- Enterprise
Lay out the trackers on real ground
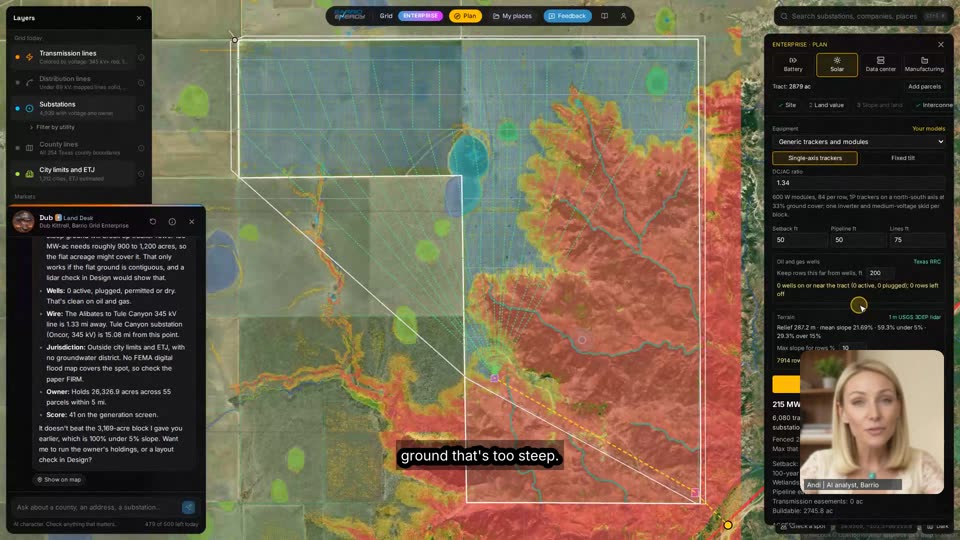
One-meter USGS lidar for the tract: rows that land on steep ground are dropped, wells get a keep-out, flood zones, wetlands and pipeline easements are cut out, and the project substation, gen-tie and switching station are placed. 2D, 3D and a rendered flyover.
- Enterprise
Merchant or PPA, then the offer
24 months of real day-ahead capture at the node with curtailment, or a PPA price you enter; base, low and high forward cases; your own capex and equipment if you load them. Then a letter or handwritten note to the owner.
How to use every solar tool
A 2 minute 40 walkthrough of each solar feature in the order you would use it, from the free map up to Enterprise. Recorded on the live map with a demo account; landowner names are masked. Click a chapter to jump to it.
- Free
0:15 Solar view and capture price
Pick the Solar view to turn on the solar layers. Price nodes color by solar capture ratio: what sunny hours pay over the all-day price.
- Free
0:30 Sunshine on any spot
Check a spot for its average sunshine, kWh a year and its Texas percentile.
- Pro
0:44 Statewide sunshine map
Global Solar Atlas irradiance across Texas, under every other layer.
- Pro
1:02 Solar generation queue
Filter the ERCOT queue to solar to see who is already in line near a node.
- Enterprise
1:11 Land filter
Parcels that fit: acreage, substation distance and voltage, and flat ground share. Edit any field; each parcel shows what it passed.
- Enterprise
1:42 Plan: site score and hookup
Plan here scores the site, then sizes the interconnection: a feeder tie for small projects or a project substation for large ones.
- Enterprise
1:57 Tracker layout on lidar
Single-axis trackers laid out on one-meter USGS lidar, with rows dropped on steep ground and shallow bedrock and kept clear of wells, lines and roads. 2D and 3D.
- Enterprise
2:17 Economics and your own models
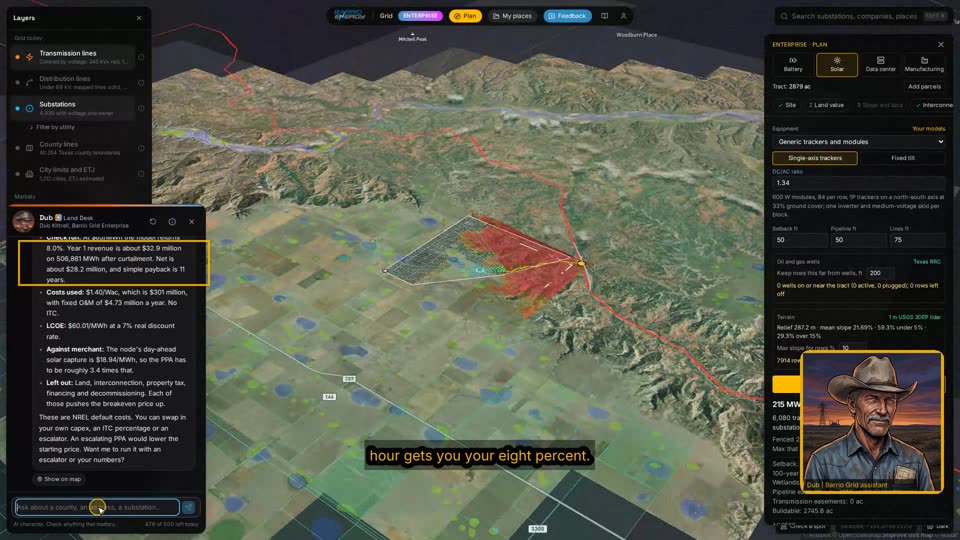
Merchant on real ERCOT prices or a PPA you set, with base, low and high price outlooks. Load your own costs and tracker specs to reprice the site.
What you get back
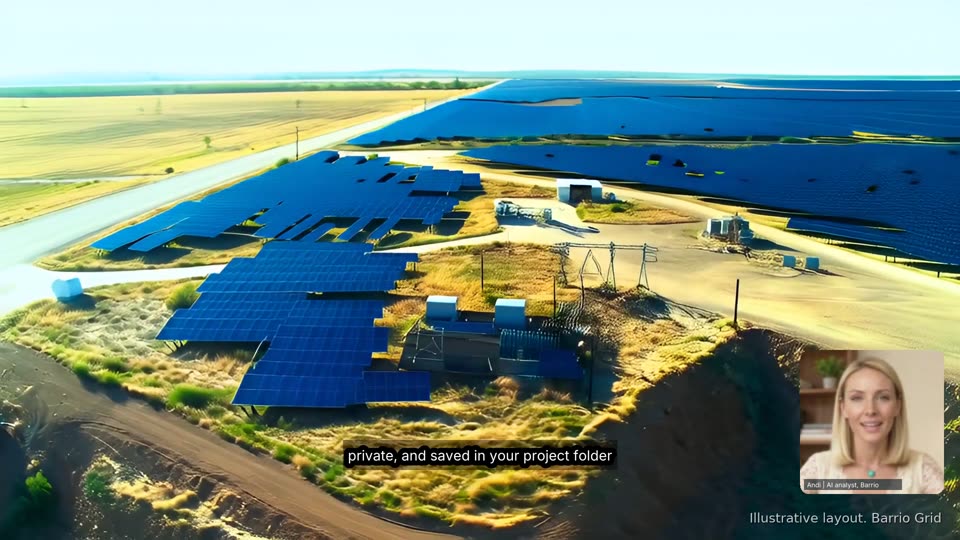
Solar siting questions
What is solar capture price and why does it matter more than the average price?
Capture price is what a solar plant is actually paid: the node price during the hours it produces. Texas now has so much solar that midday prices sit well below the daily average across much of the state, so a node with a good average can still pay solar poorly. The capture ratio in the table above shows how big that gap is at each node.
How much land does utility solar need in Texas?
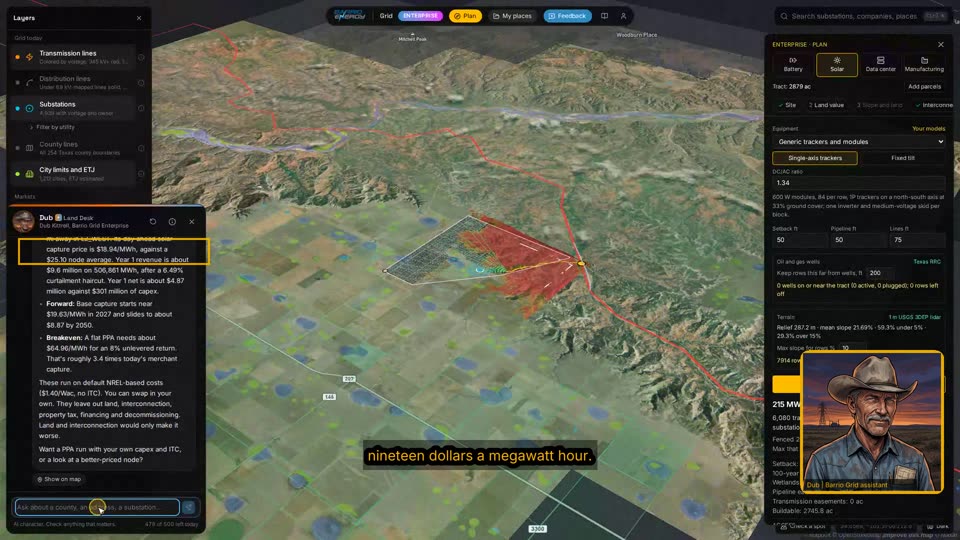
On single-axis trackers, our test layouts fence about 8 acres per MW-ac on flat ground. Slope changes that fast: on the canyon tract in the video, only about half of 2,878 acres is under 5 percent slope, and the layout still fit 215 MW after dropping rows on steep ground. Wells, flood zones and easements take more.
Does merchant solar still pencil in ERCOT?
Rarely, on recent prices. On the West Texas tract in the video, solar was paid around $19 per MWh and the project never paid back as merchant; a PPA of about $65 per MWh reached an 8 percent return. Barrio Grid runs both cases on the node's real prices so you know which conversation to have.
How is curtailment measured?
From ERCOT's solar production report: available solar (HSL) minus actual output over midday hours, as a share of available. It also catches forecast error and ramp limits, so read it as an upper bound. ERCOT does not publish curtailment by plant or region in that report, so regional figures show output and shape only.
Are tax credits included?
The credit is an input, defaulting to zero. Under the 2025 federal law, solar that begins construction after July 4, 2026 no longer qualifies for the 45Y and 48E credits, and earlier starts must be in service by the end of 2027. Set it to what your project actually qualifies for.
Can my AI assistant use this?
Yes. Barrio Grid is an MCP connector: add https://grid.barrioenergy.com/mcp to Claude or any assistant that supports MCP and ask in plain English. The same tools run the map. Setup is on the API and MCP page.
Start with the node. It is free.
20 calls a day and the map, no card. Pro is $499 a month, first month $249.