Find the ERCOT node, then the tract, then the owner.
Barrio Grid ranks every ERCOT pricing node by battery spread, shows what storage is already queued around it, and takes you from a tract to a laid-out battery, a price backcast and an offer letter in one sitting.
Widest battery spreads in ERCOT this week
Day-ahead TB4 by node, Nov 2, 2026 to Nov 9, 2026, with the storage already in the interconnection queue within 10 miles. Refreshed every morning.
| Node | TB4 / day | Per MW-yr | Neg. hours | Queued storage 10 mi | |
|---|---|---|---|---|---|
| 1 | KNAPP_RN Uvalde County | $241 | $351k | 0 | 427 MW (5) |
| 2 | OLMITO_RN Cameron County | $211 | $308k | 0 | 1450 MW (9) |
| 3 | SIL_SILAS_9 Cameron County | $211 | $308k | 0 | 262 MW (2) |
| 4 | SILASRAY_CC1 zone | $211 | $308k | 0 | not mapped |
| 5 | STWF_T1 West zone | $127 | $186k | 1 | not mapped |
| 6 | TRENT_TRENT Nolan County | $127 | $186k | 1 | 917 MW (3) |
| 7 | RUSSEKST_RN West zone | $125 | $182k | 0 | not mapped |
| 8 | SWT_BESS_RN Nolan County | $119 | $174k | 0 | none |
TB4 is the average of the four highest hourly day-ahead prices minus the four lowest, each day, averaged over the 7 days ($/MWh). Per MW-yr is TB4 x 4 x 365, gross, before efficiency, cycling limits and ancillary services. Free accounts see 7 days and the top 15 nodes; Pro adds 30 and 120 day rankings, real-time TB4, DART, 15-minute spikes and the names and MW of every queued project. Click a node to open it on the map.
How a battery screen runs on Barrio Grid
Each step is a tool your AI assistant can call through the connector, or a panel on the map.
- Free
Ask Dub in plain English
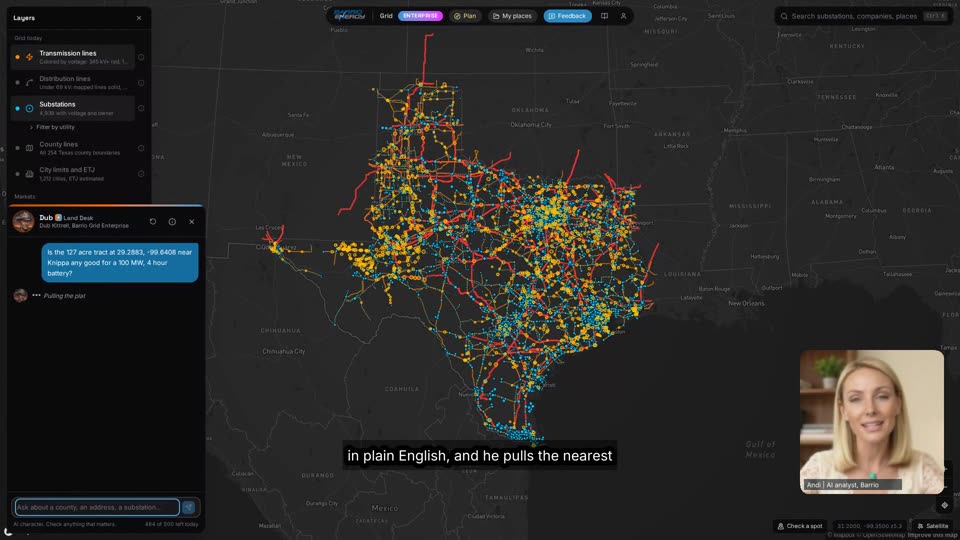
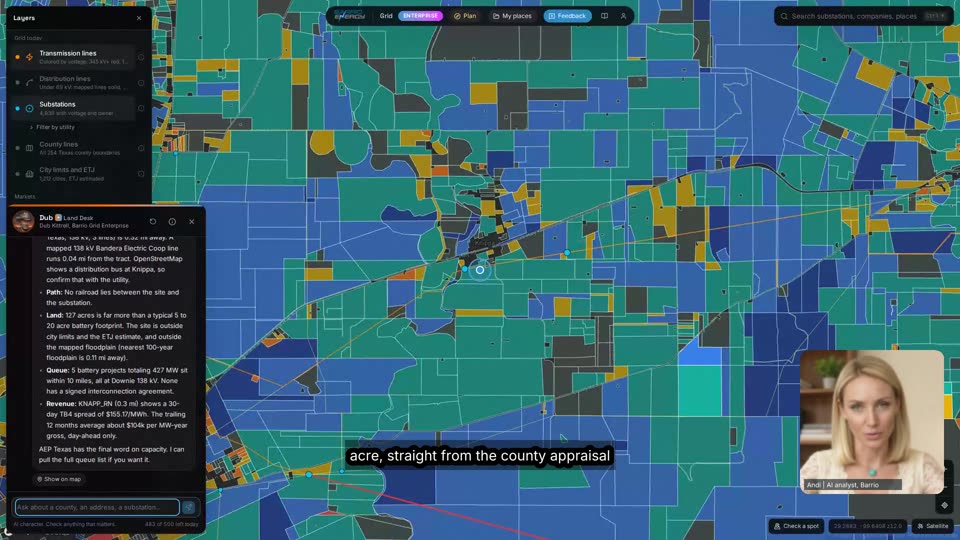
Point at a spot or a county. Dub, the map's chat landman, pulls the nearest substation and voltage, the price spread at the closest node and how much storage is already queued around it.
- Free / Pro
Rank the nodes
Sort all 1,100+ ERCOT settlement points by TB4, TB2, negative hours, evening peak or basis to the load zone, statewide or inside a radius. Pro adds 120 days, real-time spreads and DART.
- Free / Pro
Check the queue at the node
Every battery project in ERCOT's monthly GIS report near a point, a county or a named POI substation: study phase, interconnection agreement, expected COD. Pro shows names, developers and MW.
- Enterprise Lite
Find tracts and owners near the substation
Parcels by acreage, distance and kV around the substations you like, with landowner names, mailing addresses and appraisal records.
- Enterprise
Screen, price and lay out the site
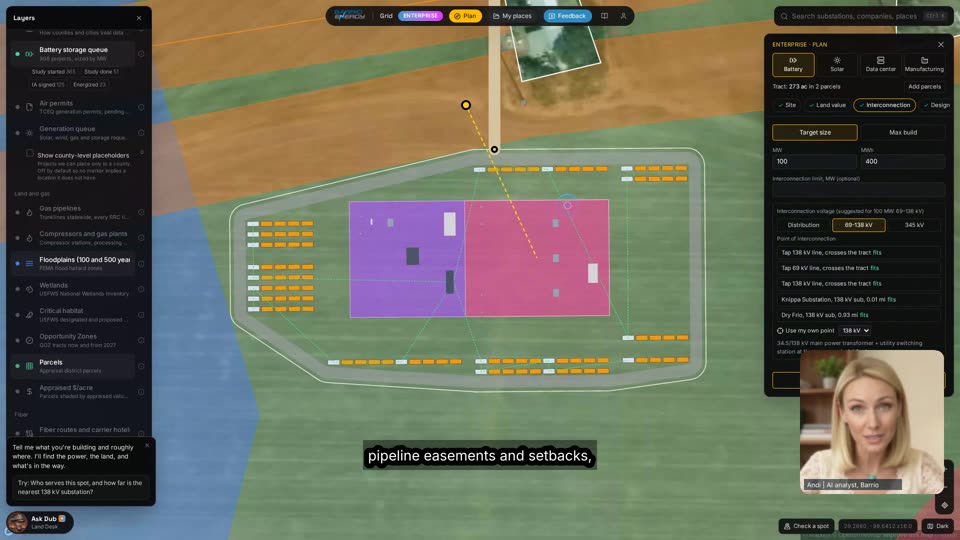
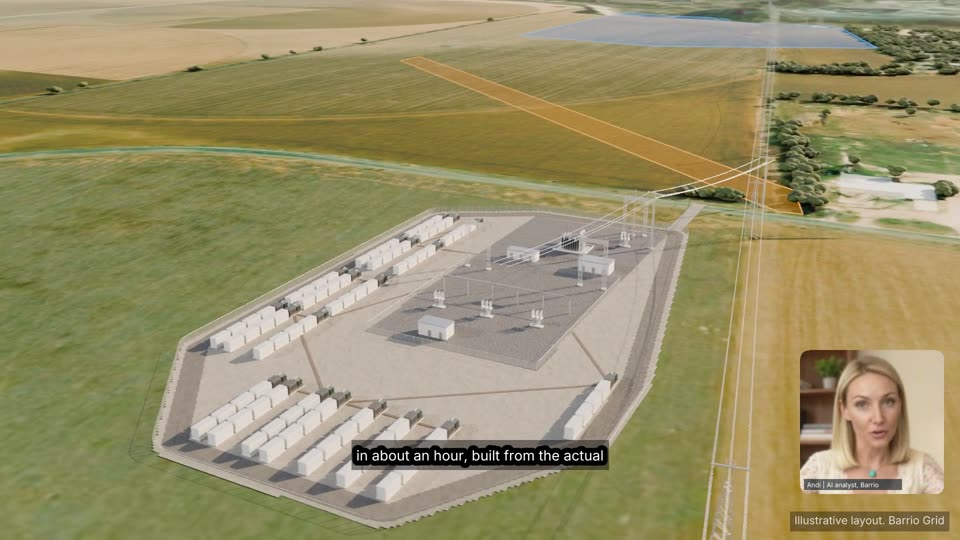
Site score with stated weights, appraised dollars per acre and nearby listings, then a layout: project substation placed nearest the interconnection, switching station on the line tap, containers and skids clear of floodplain, wetlands, pipeline easements and setbacks, in 2D and 3D. If the tract cannot hold the target, it says by how many acres.
- Enterprise
Run the numbers and send the offer
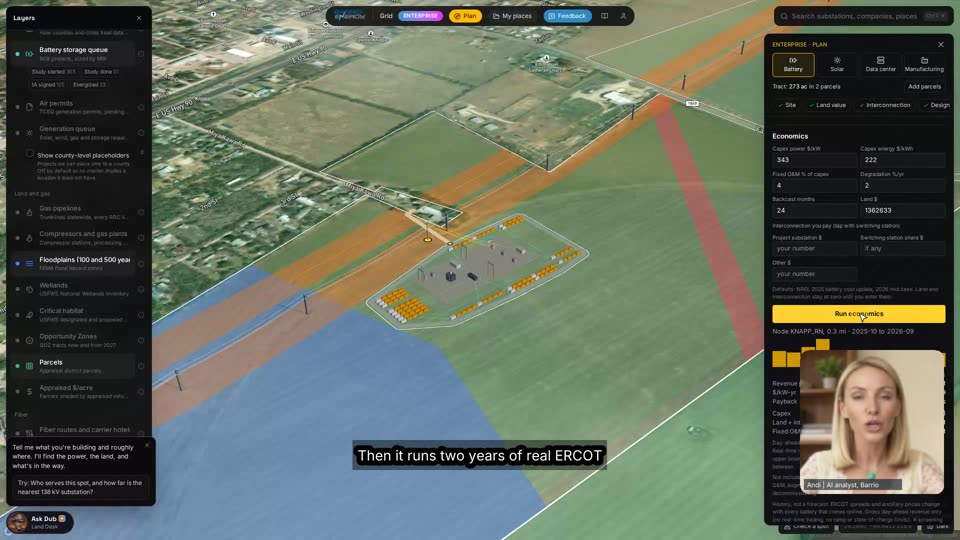
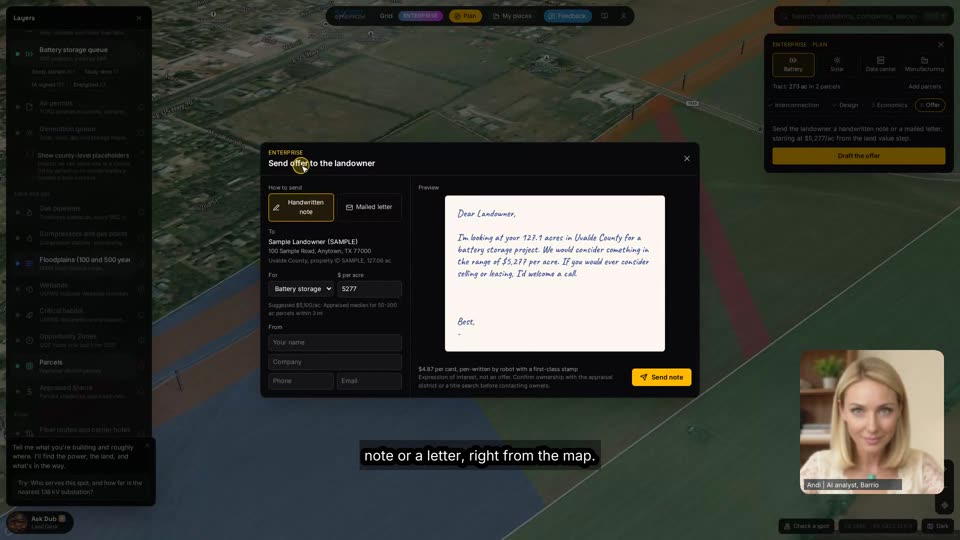
24 months of real ERCOT prices through your MW and MWh, base, low and high forward cases, your own capex model if you load one. Then a mailed letter or handwritten note to the owner, drafted from the map.
What you get back
Battery siting questions
What is TB4 and why rank nodes by it?
TB4 is the top-four minus bottom-four hourly day-ahead price spread at a node, averaged by day. It approximates what a 4-hour battery could earn from one charge and one discharge a day. Generators and batteries are paid at their own node, not the load zone, so two sites 20 miles apart can differ by tens of dollars a MWh. Barrio Grid computes it for every ERCOT settlement point from the day-ahead and real-time price files each hour.
Should a Texas battery count on ancillary services revenue?
Less than it used to. ERCOT's day-ahead clearing prices for regulation, RRS and ECRS fell from around $20 per MW-hour in early 2024 to roughly $1 to $5 in the last 30 days as storage flooded in. Energy arbitrage is most of the story now, which is why the node matters. The ancillary_prices tool shows the hourly history so you can check the current level yourself.
How much land does a 100 MW, 4-hour battery need?
Less than most people expect. In the Knippa demo in the video, 100 MW / 400 MWh in 80 containers and 20 skids, with the project substation and switching station, fenced 6.6 acres. The tract still needs room for setbacks, access and keep-outs, and the layout tool tells you whether a given parcel fits and by how many acres it falls short.
How do I see what storage is already queued near a node?
Every node in the ranking above carries the queued and operating storage within 10 miles. The battery_queue tool searches the ERCOT GIS report by point, county or POI substation and returns study phase, whether the interconnection agreement is signed and the expected COD. Free accounts see locations and status; Pro adds project names, developers and MW.
Does Barrio Grid forecast prices?
It is built on actuals: two years of real ERCOT prices at the node. The economics panel adds base, low and high forward cases built from the EIA Short-Term Energy Outlook and NREL Cambium scenarios, refreshed weekly, and you can upload your own curve. Treat all of it as screening, not a dispatch model.
Can my AI assistant use this?
Yes. Barrio Grid is an MCP connector: add https://grid.barrioenergy.com/mcp to Claude or any assistant that supports MCP and ask in plain English. The same tools run the map. Setup is on the API and MCP page.
Start with the node. It is free.
20 calls a day and the map, no card. Pro is $499 a month, first month $249.